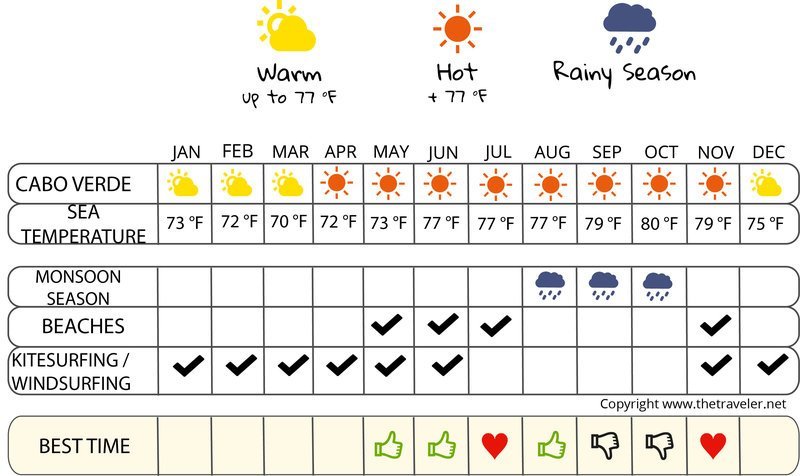
When to go to Cape Verde?

With its hot and dry tropical climate, Cape Verde experiences two seasons : the rain season between July and October and the dry season from November to June, with a particularly active wind between December and March. Average temperatures vary between 68°F and 77°F all throughout the year.
Although located in West Africa, the Cape Verde archipelago enjoys a hot and dry tropical climate. It is made up of a dry season from November to June – a cooler season with maximum temperatures around 77°F which come with winds that can be very strong, particularly in December and February. The harmattan – a wind coming from the Sahara – blows between December and March, and brings with it a haze of dust which can sometimes impede visibility. This wind on the other hand keeps windsurfers very happy.
The rain season starts in July and comes to an end towards the month of October with higher temperatures and moisture that can be found in the air. The hottest month of the year is October with temperatures which reach 86°F. The relatively strong sea currents make the sea colder and rougher than on the rest of the West African coast. The water temperature varies between 71°F and 78°F. To find out where you can swim, discover Cap Verde’s most beautiful beaches and our beach map to see details of their location.
For a trip to Cape Verde, you can go whenever you like all throughout the year. The months from December to March are very windy and are not really recommended except if you’re a lover of windsurfing. The months of September and October are hotter and rainier but are enjoyable all the same.
|
Temperatures Praia
| Jan | Feb | March | April | May | June | Jul | August | Sept | Oct | nov. | dec. | |
|---|---|---|---|---|---|---|---|---|---|---|---|---|
| Min temperature | 68° | 66° | 68° | 69° | 69° | 71° | 73° | 75° | 77° | 75° | 73° | 71° |
| Max temperature | 77° | 77° | 78° | 78° | 80° | 82° | 82° | 84° | 84° | 84° | 82° | 78° |
| Sea temperature | 75° | 73° | 73° | 71° | 73° | 73° | 75° | 78° | 78° | 80° | 78° | 75° |
Sunshine
Rainfall Praia

The weather month by month in Cape Verde
Weather Praia in January
Sea: 75 °
| 25 d/month | 4 d/month | 1 day | 1 day |
In January, in Praia, Minimum temperatures vary between 20 in the morning and 25 in the afternoon. The average rainfall is around 0 inches, for 30 days without rain.
Check the weather over the last 5 years for the dates of your stay
Weather history day by day
Weather Praia in February
Sea: 73 °
| 23 d/month | 4 d/month | 1 day | 1 day | -1 d/month |
In February, in Praia, Minimum temperatures vary between 19 in the morning and 25 in the afternoon. The average rainfall is around 6 inches, for 30 days without rain.
Check the weather over the last 5 years for the dates of your stay
Weather history day by day
Weather Praia in March
Sea: 73 °
| 28 d/month | 2 d/month | 1 day |
In March, in Praia, Minimum temperatures vary between 20 in the morning and 26 in the afternoon. Temperatures are hot. The average rainfall is around 0 inches, for 31 days without rain.
Check the weather over the last 5 years for the dates of your stay
Weather history day by day
Weather Praia in April
Sea: 71 °
| 28 d/month | 2 d/month |
In April, in Praia, Minimum temperatures vary between 21 in the morning and 26 in the afternoon. Temperatures are hot. The average rainfall is around 0 inches, for 31 days without rain.
Check the weather over the last 5 years for the dates of your stay
Weather history day by day
Weather Praia in May
Sea: 73 °
| 29 d/month | 2 d/month |
In May, in Praia, Minimum temperatures vary between 21 in the morning and 27 in the afternoon. Temperatures are hot. The average rainfall is around 0 inches, for 31 days without rain.
Check the weather over the last 5 years for the dates of your stay
Weather history day by day
Weather Praia in June
Sea: 73 °
| 25 d/month | 4 d/month | 1 day |
In June, in Praia, Minimum temperatures vary between 22 in the morning and 28 in the afternoon. Temperatures are hot. The average rainfall is around 0 inches, for 31 days without rain.
Check the weather over the last 5 years for the dates of your stay
Weather history day by day
Weather Praia in July
Sea: 75 °
| 16 d/month | 8 d/month | 3 d/month | 2 d/month | 1 day | 1 day |
In July, in Praia, Minimum temperatures vary between 23 in the morning and 28 in the afternoon. Temperatures are hot. The average rainfall is around 3 inches, for 28 days without rain.
Check the weather over the last 5 years for the dates of your stay
Weather history day by day
Weather Praia in August
Sea: 78 °
| 9 d/month | 9 d/month | 7 d/month | 4 d/month | 1 day | 1 day |
In August, in Praia, Minimum temperatures vary between 24 in the morning and 29 in the afternoon. Temperatures are hot. The average rainfall is around 9 inches, for 21 days without rain.
Check the weather over the last 5 years for the dates of your stay
Weather history day by day
Weather Praia in September
Sea: 78 °
| 11 d/month | 7 d/month | 6 d/month | 3 d/month | 3 d/month |
In September, in Praia, Minimum temperatures vary between 25 in the morning and 29 in the afternoon. Temperatures are hot. The average rainfall is around 21 inches, for 21 days without rain.
Check the weather over the last 5 years for the dates of your stay
Weather history day by day
Weather Praia in October
Sea: 80 °
| 18 d/month | 6 d/month | 4 d/month | 2 d/month | 1 day |
In October, in Praia, Minimum temperatures vary between 24 in the morning and 29 in the afternoon. Temperatures are hot. The average rainfall is around 33 inches, for 25 days without rain.
Check the weather over the last 5 years for the dates of your stay
Weather history day by day
Weather Praia in November
Sea: 78 °
| 17 d/month | 8 d/month | 2 d/month | 1 day | 1 day | 1 day |
In November, in Praia, Minimum temperatures vary between 23 in the morning and 28 in the afternoon. Temperatures are hot. The average rainfall is around 0 inches, for 29 days without rain.
Check the weather over the last 5 years for the dates of your stay
Weather history day by day
Weather Praia in December
Sea: 75 °
| 21 d/month | 7 d/month | 2 d/month | 1 day |
In December, in Praia, Minimum temperatures vary between 22 in the morning and 26 in the afternoon. Temperatures are hot. The average rainfall is around 0 inches, for 30 days without rain.
Check the weather over the last 5 years for the dates of your stay
Weather history day by day
Temperature and climate in:
Boa Vista | Espargos | Mindelo | Praia | Sal Island | Santa Maria | Santo Antão |