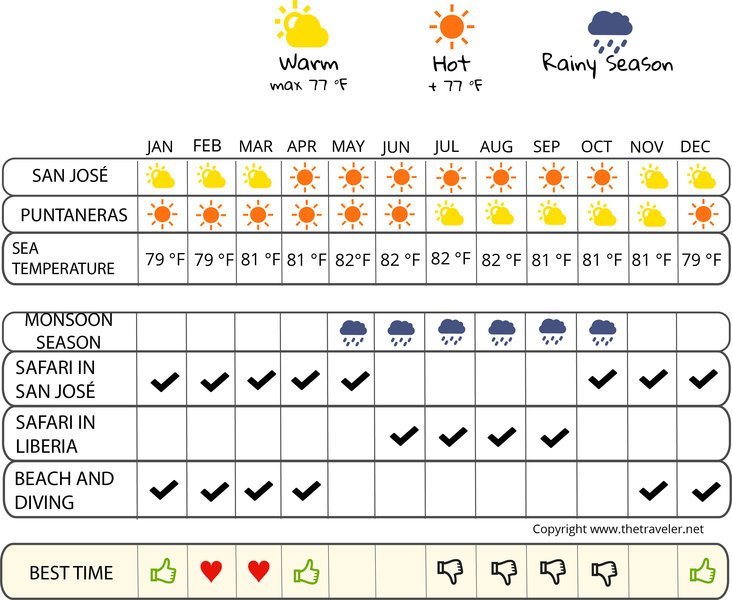
When to go to Costa Rica?

|
Temperature and climate in:
Arenal Volcano | Bahía de Salinas | Cahuita | Cerro Santa María | Cocos Island | Dominical | Guaitil | Isla Uvita | La Fortuna | Liberia | Montezuma | Playa Palma | Puerto Jiménez | Puerto Limón | Samara | San José | Sarchí | Volcán Turrialba |The weather month by month in Costa Rica
Weather San José in January
Sea: 32 °
| 15 d/month | 10 d/month | 4 d/month | 1 day | 1 day |
In January, in San José, Minimum temperatures vary between 18 in the morning and 28 in the afternoon. Temperatures are hot. The average rainfall is around 8 inches, for 20 days without rain.
Check the weather over the last 5 years for the dates of your stay
Weather history day by day
Weather San José in February
Sea: 32 °
| 14 d/month | 9 d/month | 3 d/month | 2 d/month |
In February, in San José, Minimum temperatures vary between 18 in the morning and 29 in the afternoon. Temperatures are hot. The average rainfall is around 10 inches, for 20 days without rain.
Check the weather over the last 5 years for the dates of your stay
Weather history day by day
Weather San José in March
Sea: 32 °
| 13 d/month | 13 d/month | 4 d/month | 1 day |
In March, in San José, Minimum temperatures vary between 18 in the morning and 30 in the afternoon. The average rainfall is around 8 inches, for 17 days without rain.
Check the weather over the last 5 years for the dates of your stay
Weather history day by day
Weather San José in April
Sea: 32 °
| 14 d/month | 8 d/month | 6 d/month | 2 d/month |
In April, in San José, Minimum temperatures vary between 19 in the morning and 30 in the afternoon. The average rainfall is around 45 inches, for 11 days without rain.
Check the weather over the last 5 years for the dates of your stay
Weather history day by day
Weather San José in May
Sea: 32 °
| 14 d/month | 13 d/month | 3 d/month | 1 day |
In May, in San José, Minimum temperatures vary between 19 in the morning and 29 in the afternoon. Temperatures are hot. The average rainfall is around 169 inches, for 4 days without rain.
Check the weather over the last 5 years for the dates of your stay
Weather history day by day
Weather San José in June
Sea: 32 °
| 17 d/month | 11 d/month | 1 day | 1 day |
In June, in San José, Minimum temperatures vary between 19 in the morning and 28 in the afternoon. Temperatures are hot. The average rainfall is around 206 inches, for 3 days without rain.
Check the weather over the last 5 years for the dates of your stay
Weather history day by day
Weather San José in July
Sea: 32 °
| 16 d/month | 14 d/month | 1 day |
In July, in San José, Minimum temperatures vary between 19 in the morning and 28 in the afternoon. Temperatures are hot. The average rainfall is around 140 inches, for 1 days without rain.
Check the weather over the last 5 years for the dates of your stay
Weather history day by day
Weather San José in August
Sea: 32 °
| 15 d/month | 12 d/month | 3 d/month | 1 day |
In August, in San José, Minimum temperatures vary between 18 in the morning and 28 in the afternoon. Temperatures are hot. The average rainfall is around 191 inches, for 4 days without rain.
Check the weather over the last 5 years for the dates of your stay
Weather history day by day
Weather San José in September
Sea: 32 °
| 20 d/month | 10 d/month |
In September, in San José, Minimum temperatures vary between 18 in the morning and 28 in the afternoon. Temperatures are hot. The average rainfall is around 239 inches, for 1 days without rain.
Check the weather over the last 5 years for the dates of your stay
Weather history day by day
Weather San José in October
Sea: 32 °
| 17 d/month | 13 d/month | 1 day |
In October, in San José, Minimum temperatures vary between 18 in the morning and 28 in the afternoon. Temperatures are hot. The average rainfall is around 290 inches, for 1 days without rain.
Check the weather over the last 5 years for the dates of your stay
Weather history day by day
Weather San José in November
Sea: 32 °
| 17 d/month | 9 d/month | 2 d/month | 2 d/month |
In November, in San José, Minimum temperatures vary between 18 in the morning and 28 in the afternoon. Temperatures are hot. The average rainfall is around 137 inches, for 5 days without rain.
Check the weather over the last 5 years for the dates of your stay
Weather history day by day
Weather San José in December
Sea: 32 °
| 15 d/month | 8 d/month | 5 d/month | 3 d/month |
In December, in San José, Minimum temperatures vary between 18 in the morning and 28 in the afternoon. Temperatures are hot. The average rainfall is around 44 inches, for 11 days without rain.
Check the weather over the last 5 years for the dates of your stay
Weather history day by day