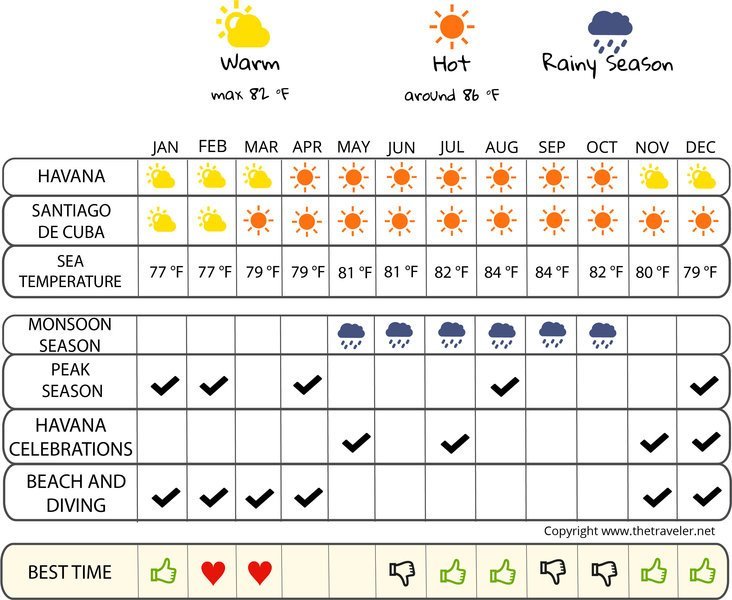
When to go to Cuba?

The country experiences a tropical climate characterised by two distinct seasons. The wet season stretches from June to mid-October and ties in with the summer season. The rain can be fierce, especially in the regions of Havana and Pinar el Rio. The water temperature can climb to 86°F in certain areas, a godsend for swimmers and lovers of scuba diving. The dry season comes along towards the end of the month of November and lasts until May. Even if it’s winter, the temperature stays warm with an average temperature of 75°F. A trip to Cuba from November to May is therefore particularly enjoyable in order to make the most of Cuban nature.
Below you will find all the climatic information to know when to go to Cuba.
|
Temperatures Havana
| Jan | Feb | March | April | May | June | Jul | August | Sept | Oct | nov. | dec. | |
|---|---|---|---|---|---|---|---|---|---|---|---|---|
| Min temperature | 62° | 62° | 64° | 66° | 69° | 73° | 73° | 73° | 73° | 71° | 66° | 64° |
| Max temperature | 78° | 80° | 82° | 86° | 87° | 89° | 89° | 89° | 87° | 86° | 82° | 80° |
| Sea temperature | 78° | 78° | 78° | 80° | 82° | 84° | 84° | 86° | 86° | 84° | 82° | 80° |
Sunshine
Rainfall Havana

The weather month by month in Cuba
Weather Havana in January
Sea: 78 °
| 11 d/month | 6 d/month | 5 d/month | 3 d/month | 3 d/month | 3 d/month |
In January, in Havana, Minimum temperatures vary between 17 in the morning and 26 in the afternoon. Temperatures are hot. The average rainfall is around 70 inches, for 23 days without rain.
Check the weather over the last 5 years for the dates of your stay
Weather history day by day
Weather Havana in February
Sea: 78 °
| 12 d/month | 5 d/month | 4 d/month | 4 d/month | 2 d/month | 1 day |
In February, in Havana, Minimum temperatures vary between 17 in the morning and 27 in the afternoon. Temperatures are hot. The average rainfall is around 45 inches, for 26 days without rain.
Check the weather over the last 5 years for the dates of your stay
Weather history day by day
Weather Havana in March
Sea: 78 °
| 15 d/month | 4 d/month | 4 d/month | 4 d/month | 2 d/month | 2 d/month |
In March, in Havana, Minimum temperatures vary between 18 in the morning and 28 in the afternoon. Temperatures are hot. The average rainfall is around 45 inches, for 25 days without rain.
Check the weather over the last 5 years for the dates of your stay
Weather history day by day
Weather Havana in April
Sea: 80 °
| 13 d/month | 5 d/month | 5 d/month | 3 d/month | 2 d/month | 2 d/month |
In April, in Havana, Minimum temperatures vary between 19 in the morning and 30 in the afternoon. The average rainfall is around 60 inches, for 23 days without rain.
Check the weather over the last 5 years for the dates of your stay
Weather history day by day
Weather Havana in May
Sea: 82 °
| 10 d/month | 8 d/month | 6 d/month | 3 d/month | 2 d/month | 2 d/month |
In May, in Havana, Minimum temperatures vary between 21 in the morning and 31 in the afternoon. Températures are really hot. The average rainfall is around 120 inches, for 17 days without rain.
Check the weather over the last 5 years for the dates of your stay
Weather history day by day
Weather Havana in June
Sea: 84 °
| 10 d/month | 8 d/month | 6 d/month | 4 d/month | 1 day | 1 day |
In June, in Havana, Minimum temperatures vary between 23 in the morning and 32 in the afternoon. Températures are really hot. The average rainfall is around 165 inches, for 13 days without rain.
Check the weather over the last 5 years for the dates of your stay
Weather history day by day
Weather Havana in July
Sea: 84 °
| 10 d/month | 9 d/month | 7 d/month | 3 d/month | 1 day | 1 day |
In July, in Havana, Minimum temperatures vary between 23 in the morning and 32 in the afternoon. Températures are really hot. The average rainfall is around 125 inches, for 15 days without rain.
Check the weather over the last 5 years for the dates of your stay
Weather history day by day
Weather Havana in August
Sea: 86 °
| 9 d/month | 9 d/month | 6 d/month | 5 d/month | 1 day | 1 day |
In August, in Havana, Minimum temperatures vary between 23 in the morning and 32 in the afternoon. Températures are really hot. The average rainfall is around 135 inches, for 16 days without rain.
Check the weather over the last 5 years for the dates of your stay
Weather history day by day
Weather Havana in September
Sea: 86 °
| 8 d/month | 8 d/month | 5 d/month | 5 d/month | 2 d/month | 2 d/month |
In September, in Havana, Minimum temperatures vary between 23 in the morning and 31 in the afternoon. Températures are really hot. The average rainfall is around 150 inches, for 18 days without rain.
Check the weather over the last 5 years for the dates of your stay
Weather history day by day
Weather Havana in October
Sea: 84 °
| 10 d/month | 6 d/month | 6 d/month | 3 d/month | 3 d/month | 3 d/month |
In October, in Havana, Minimum temperatures vary between 22 in the morning and 30 in the afternoon. The average rainfall is around 170 inches, for 15 days without rain.
Check the weather over the last 5 years for the dates of your stay
Weather history day by day
Weather Havana in November
Sea: 82 °
| 8 d/month | 6 d/month | 6 d/month | 5 d/month | 3 d/month | 2 d/month |
In November, in Havana, Minimum temperatures vary between 19 in the morning and 28 in the afternoon. Temperatures are hot. The average rainfall is around 80 inches, for 23 days without rain.
Check the weather over the last 5 years for the dates of your stay
Weather history day by day
Weather Havana in December
Sea: 80 °
| 10 d/month | 6 d/month | 5 d/month | 4 d/month | 4 d/month | 2 d/month |
In December, in Havana, Minimum temperatures vary between 18 in the morning and 27 in the afternoon. Temperatures are hot. The average rainfall is around 60 inches, for 24 days without rain.
Check the weather over the last 5 years for the dates of your stay
Weather history day by day
Temperature and climate in:
Baracoa | Cienfuegos | Havana | La Norma | Santa Clara | Santiago de Cuba | Trinidad | Varadero |