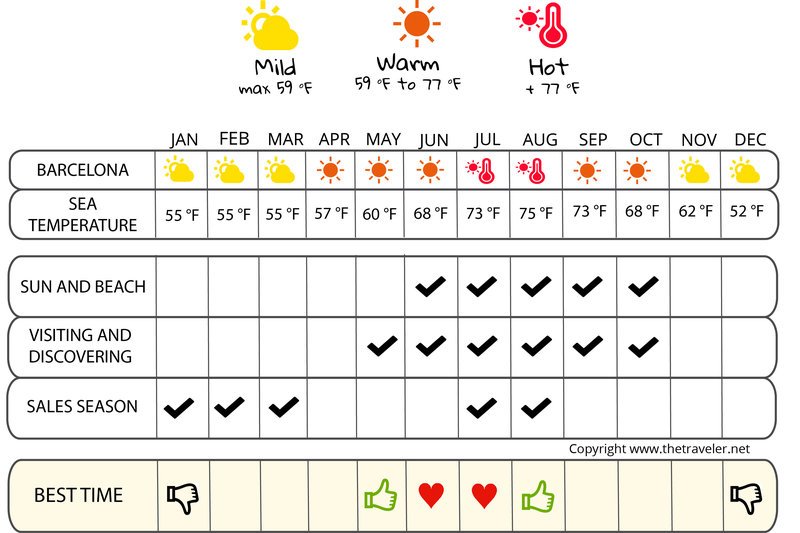
When to go to Barcelona?

A pleasant climate throughout the year is undoubtedly one of the characteristic aspects of Barcelona. For your getaway to Barcelona, spring and summer are the ideal seasons to visit and discover the city, but also to enjoy the beach and sunshine. Note that March should be avoided as it is often rainy. The late season is also very pleasant, however, the months of October and November are often punctuated by rain in the form of short and violent storms.
Some of Barcelona’s cultural and artistic events include:
• 5/6 January: Epiphany - the Three Wise Men distribute gifts to children, and march through the streets.
• April 23rd: Feast of Sant Jordi, protector of Catalonia. According to tradition, book stands and stalls of roses are dotted throughout the city.
June 24: St. John's Day when fireworks and neighbourhood festivals are organised.
September 24: Feast of Mercé Musical events are organised throughout the city for the patron saint of Barcelona.
|
Temperatures Barcelona
| Jan | Feb | March | April | May | June | Jul | August | Sept | Oct | nov. | dec. | |
|---|---|---|---|---|---|---|---|---|---|---|---|---|
| Min temperature | 41° | 42° | 46° | 50° | 55° | 62° | 68° | 69° | 62° | 57° | 48° | 42° |
| Max temperature | 57° | 59° | 62° | 64° | 71° | 77° | 82° | 84° | 78° | 71° | 62° | 57° |
| Sea temperature | 57° | 55° | 57° | 59° | 64° | 69° | 75° | 78° | 75° | 71° | 64° | 60° |
Sunshine
Rainfall Barcelona

The weather month by month in Barcelona
Weather Barcelona in January
Sea: 57 °
| 18 d/month | 6 d/month | 2 d/month | 2 d/month | 2 d/month | 1 day |
In January, in Barcelona, temperatures range from 5 to 14 degrees. Temperatures are low but with a lot of sunshine. The average rainfall is around 47 inches, for 27 days without rain.
Check the weather over the last 5 years for the dates of your stay
Weather history day by day
Weather Barcelona in February
Sea: 55 °
| 16 d/month | 6 d/month | 2 d/month | 2 d/month | 2 d/month | 1 day | -1 d/month |
In February, in Barcelona, temperatures range from 6 to 15 degrees. Temperatures are low but with a lot of sunshine. The average rainfall is around 23 inches, 28 days without rain in February
Check the weather over the last 5 years for the dates of your stay
Weather history day by day
Weather Barcelona in March
Sea: 57 °
| 19 d/month | 6 d/month | 3 d/month | 2 d/month | 1 day |
In March, in Barcelona, Minimum temperatures vary between 8 in the morning and 17 in the afternoon. The average rainfall is around 55 inches, for 26 days without rain.
Check the weather over the last 5 years for the dates of your stay
Weather history day by day
Weather Barcelona in April
Sea: 59 °
| 17 d/month | 5 d/month | 4 d/month | 2 d/month | 1 day | 1 day |
In April, in Barcelona, temperatures range from 10 to 18 degrees. Rainfall in April: 42 inches, for about 25 days without rain.
Check the weather over the last 5 years for the dates of your stay
Weather history day by day
Weather Barcelona in May
Sea: 64 °
| 20 d/month | 5 d/month | 3 d/month | 2 d/month | 1 day |
In May, in Barcelona, Minimum temperatures vary between 13 in the morning and 22 in the afternoon. The average rainfall is around 49 inches, for 24 days without rain.
Check the weather over the last 5 years for the dates of your stay
Weather history day by day
Weather Barcelona in June
Sea: 69 °
| 23 d/month | 4 d/month | 2 d/month | 1 day |
In June, in Barcelona, Minimum temperatures vary between 17 in the morning and 25 in the afternoon. The average rainfall is around 28 inches, for 26 days without rain.
Check the weather over the last 5 years for the dates of your stay
Weather history day by day
Weather Barcelona in July
Sea: 75 °
| 25 d/month | 3 d/month | 2 d/month | 1 day |
In July, in Barcelona, Minimum temperatures vary between 20 in the morning and 28 in the afternoon. Temperatures are hot. The average rainfall is around 26 inches, for 27 days without rain.
Check the weather over the last 5 years for the dates of your stay
Weather history day by day
Weather Barcelona in August
Sea: 78 °
| 23 d/month | 5 d/month | 2 d/month | 1 day |
In August, in Barcelona, Minimum temperatures vary between 21 in the morning and 29 in the afternoon. Temperatures are hot. The average rainfall is around 65 inches, for 25 days without rain.
Check the weather over the last 5 years for the dates of your stay
Weather history day by day
Weather Barcelona in September
Sea: 75 °
| 19 d/month | 6 d/month | 3 d/month | 1 day | 1 day |
In September, in Barcelona, Minimum temperatures vary between 17 in the morning and 26 in the afternoon. Temperatures are hot. The average rainfall is around 78 inches, for 24 days without rain.
Check the weather over the last 5 years for the dates of your stay
Weather history day by day
Weather Barcelona in October
Sea: 71 °
| 16 d/month | 6 d/month | 5 d/month | 2 d/month | 2 d/month |
In October, in Barcelona, les températures moyennes le matin sont de %s et de %s ° l'après midi. The average rainfall is around 84 inches, for 23 days without rain.
Check the weather over the last 5 years for the dates of your stay
Weather history day by day
Weather Barcelona in November
Sea: 64 °
| 15 d/month | 7 d/month | 4 d/month | 2 d/month | 2 d/month |
In November, in Barcelona, temperatures range from 9 to 17 degrees. Rainfall in November: 59 inches, for about 25 days without rain.
Check the weather over the last 5 years for the dates of your stay
Weather history day by day
Weather Barcelona in December
Sea: 60 °
| 18 d/month | 7 d/month | 2 d/month | 2 d/month | 1 day | 1 day |
In December, in Barcelona, temperatures range from 6 to 14 degrees. Temperatures are low but with a lot of sunshine. The average rainfall is around 46 inches, 28 days without rain in December
Check the weather over the last 5 years for the dates of your stay
Weather history day by day