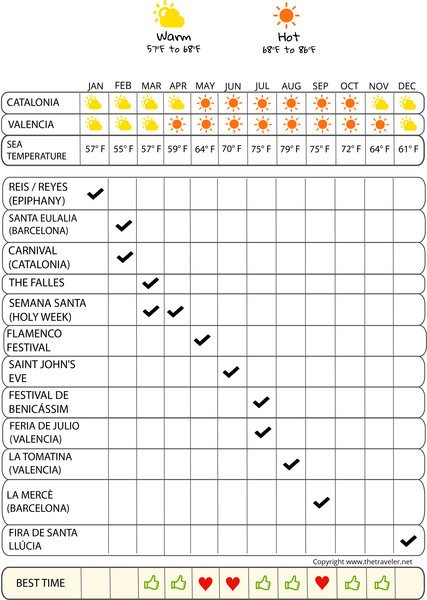
When to go to the Spanish Coasts?
If Spain can be visited all year, the months of May, June and September are ideal for their good weather conditions, while avoiding the tourist crowds. Spend a holiday on the Mediterranean coasts of Spain, with the promise of a mild winter and a hot and dry summer. Catalonia has a mild and temperate climate all year round. In summer, you can escape the excessive heat of the Mediterranean coast by taking refuge in northern Spain on the Atlantic beaches.
|
Temperatures Valencia
| Jan | Feb | March | April | May | June | Jul | August | Sept | Oct | nov. | dec. | |
|---|---|---|---|---|---|---|---|---|---|---|---|---|
| Min temperature | 41° | 42° | 46° | 50° | 57° | 64° | 68° | 69° | 64° | 57° | 48° | 42° |
| Max temperature | 60° | 62° | 68° | 69° | 75° | 82° | 87° | 87° | 82° | 75° | 68° | 60° |
| Sea temperature | 57° | 57° | 57° | 60° | 66° | 73° | 77° | 78° | 75° | 71° | 66° | 60° |
Sunshine
Rainfall Valencia

The weather month by month in the Spanish Coasts
Weather Valencia in January
Sea: 57 °
| 19 d/month | 6 d/month | 2 d/month | 2 d/month | 1 day | 1 day |
In January, in Valencia, temperatures range from 5 to 16 degrees. Temperatures are low but with a lot of sunshine. The average rainfall is around 37 inches, for 28 days without rain.
Check the weather over the last 5 years for the dates of your stay
Weather history day by day
Weather Valencia in February
Sea: 57 °
| 16 d/month | 5 d/month | 2 d/month | 2 d/month | 2 d/month | 1 day |
In February, in Valencia, temperatures range from 6 to 17 degrees. Temperatures are low but with a lot of sunshine. The average rainfall is around 40 inches, 27 days without rain in February
Check the weather over the last 5 years for the dates of your stay
Weather history day by day
Weather Valencia in March
Sea: 57 °
| 18 d/month | 6 d/month | 3 d/month | 2 d/month | 2 d/month |
In March, in Valencia, Minimum temperatures vary between 8 in the morning and 20 in the afternoon. The weather is sunny and Pleasant. The average rainfall is around 29 inches, for 26 days without rain.
Check the weather over the last 5 years for the dates of your stay
Weather history day by day
Weather Valencia in April
Sea: 60 °
| 20 d/month | 5 d/month | 2 d/month | 2 d/month | 1 day |
In April, in Valencia, temperatures range from 10 to 21 degrees. The weather is sunny and Pleasant. Rainfall in April: 35 inches, for about 27 days without rain.
Check the weather over the last 5 years for the dates of your stay
Weather history day by day
Weather Valencia in May
Sea: 66 °
| 24 d/month | 4 d/month | 1 day | 1 day | 1 day |
In May, in Valencia, les températures moyennes le matin sont de %s et de %s ° l'après midi. The average rainfall is around 42 inches, for 29 days without rain.
Check the weather over the last 5 years for the dates of your stay
Weather history day by day
Weather Valencia in June
Sea: 73 °
| 25 d/month | 3 d/month | 1 day | 1 day |
In June, in Valencia, Minimum temperatures vary between 18 in the morning and 28 in the afternoon. Temperatures are hot. The average rainfall is around 17 inches, for 29 days without rain.
Check the weather over the last 5 years for the dates of your stay
Weather history day by day
Weather Valencia in July
Sea: 77 °
| 26 d/month | 2 d/month | 1 day | 1 day | 1 day |
In July, in Valencia, Minimum temperatures vary between 20 in the morning and 31 in the afternoon. Températures are really hot. The average rainfall is around 16 inches, for 30 days without rain.
Check the weather over the last 5 years for the dates of your stay
Weather history day by day
Weather Valencia in August
Sea: 78 °
| 24 d/month | 3 d/month | 2 d/month | 1 day | 1 day |
In August, in Valencia, Minimum temperatures vary between 21 in the morning and 31 in the afternoon. Températures are really hot. The average rainfall is around 12 inches, for 28 days without rain.
Check the weather over the last 5 years for the dates of your stay
Weather history day by day
Weather Valencia in September
Sea: 75 °
| 23 d/month | 3 d/month | 2 d/month | 1 day | 1 day |
In September, in Valencia, Minimum temperatures vary between 18 in the morning and 28 in the afternoon. Temperatures are hot. The average rainfall is around 77 inches, for 28 days without rain.
Check the weather over the last 5 years for the dates of your stay
Weather history day by day
Weather Valencia in October
Sea: 71 °
| 19 d/month | 5 d/month | 4 d/month | 2 d/month | 1 day |
In October, in Valencia, les températures moyennes le matin sont de %s et de %s ° l'après midi. The average rainfall is around 70 inches, for 26 days without rain.
Check the weather over the last 5 years for the dates of your stay
Weather history day by day
Weather Valencia in November
Sea: 66 °
| 16 d/month | 7 d/month | 2 d/month | 2 d/month | 2 d/month | 1 day |
In November, in Valencia, temperatures range from 9 to 20 degrees. The weather is sunny and Pleasant. Rainfall in November: 38 inches, for about 27 days without rain.
Check the weather over the last 5 years for the dates of your stay
Weather history day by day
Weather Valencia in December
Sea: 60 °
| 17 d/month | 8 d/month | 2 d/month | 2 d/month | 1 day | 1 day |
In December, in Valencia, temperatures range from 6 to 16 degrees. Temperatures are low but with a lot of sunshine. The average rainfall is around 61 inches, 28 days without rain in December
Check the weather over the last 5 years for the dates of your stay
Weather history day by day
Influx of tourists
Temperature and climate in:
Alcossebre | Alicante | Altafulla | Altea | Badalona | Benidorm | Blanes | Calafell | Calella | Cambrils | Coma-ruga | Creixell | Crevillent | Denia | Empuriabrava | Girona | Guardamar del Segura | l'Alfàs del Pi | L'Hospitalet de Llobregat | La Manga del Mar Menor | Lloret de Mar | Malgrat de Mar | Manga del Mar Menor | Miami Platja | Montbrió del Camp | Palafrugell | Pals | Peñíscola | Pineda de Mar | Reus | Salou | San Pedro del Pinatar | Sant Pere Pescador | Segur de Calafell | Sitges | Tarragona | Tossa de Mar | Valencia | Valls | Vilaseca |