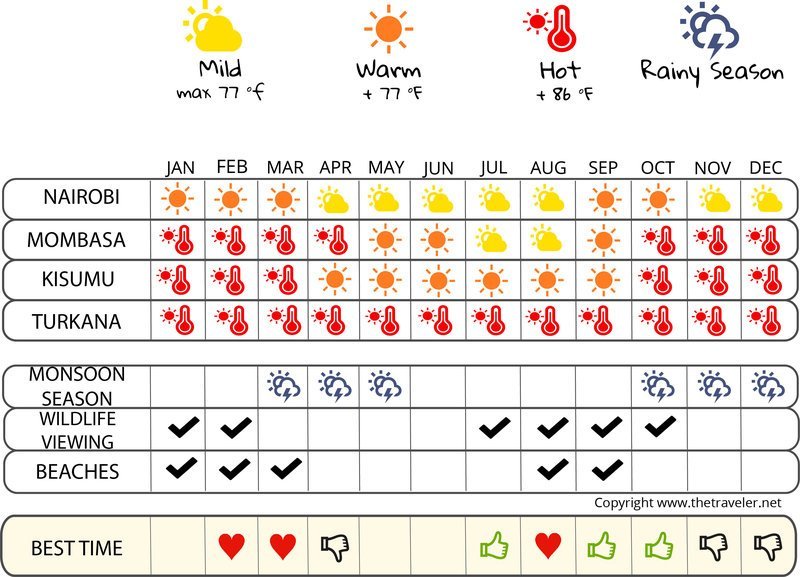
When to go to Kenya?

|
Temperature and climate in:
Amboseli | Diani Beach | Kisumu | Lake Naivasha | Lamu | Loitokitok | Maasai Mara | Malindi | Manda Bay | Maralal | Marsabit | Mombasa | Nairobi | Nakuru | Nyali Beach | Samburu | Tsavo National Park East | Voi | Watamu |The weather month by month in Kenya
Weather Nairobi in January
Sea: 32 °
| 23 d/month | 6 d/month | 1 day | 1 day |
In January, in Nairobi, les températures moyennes le matin sont de %s et de %s ° l'après midi. Temperatures are hot. The average rainfall is around 73 inches, for 24 days without rain.
Check the weather over the last 5 years for the dates of your stay
Weather history day by day
Weather Nairobi in February
Sea: 32 °
| 20 d/month | 6 d/month | 2 d/month | 1 day | -1 d/month |
In February, in Nairobi, Minimum temperatures vary between 13 in the morning and 28 in the afternoon. Temperatures are hot. The average rainfall is around 48 inches, for 24 days without rain.
Check the weather over the last 5 years for the dates of your stay
Weather history day by day
Weather Nairobi in March
Sea: 32 °
| 17 d/month | 10 d/month | 3 d/month | 1 day |
In March, in Nairobi, Minimum temperatures vary between 15 in the morning and 28 in the afternoon. Temperatures are hot. The average rainfall is around 89 inches, for 20 days without rain.
Check the weather over the last 5 years for the dates of your stay
Weather history day by day
Weather Nairobi in April
Sea: 32 °
| 15 d/month | 7 d/month | 5 d/month | 3 d/month |
In April, in Nairobi, Minimum temperatures vary between 15 in the morning and 26 in the afternoon. Temperatures are hot. The average rainfall is around 119 inches, for 11 days without rain.
Check the weather over the last 5 years for the dates of your stay
Weather history day by day
Weather Nairobi in May
Sea: 32 °
| 19 d/month | 6 d/month | 3 d/month | 3 d/month |
In May, in Nairobi, les températures moyennes le matin sont de %s et de %s ° l'après midi. The average rainfall is around 129 inches, for 9 days without rain.
Check the weather over the last 5 years for the dates of your stay
Weather history day by day
Weather Nairobi in June
Sea: 32 °
| 17 d/month | 8 d/month | 4 d/month | 1 day |
In June, in Nairobi, Minimum temperatures vary between 13 in the morning and 24 in the afternoon. The average rainfall is around 15 inches, for 13 days without rain.
Check the weather over the last 5 years for the dates of your stay
Weather history day by day
Weather Nairobi in July
Sea: 32 °
| 14 d/month | 9 d/month | 7 d/month | 1 day |
In July, in Nairobi, l'amplitude des températures varient de 12 à 23 ° dans la journée. The average rainfall is around 14 inches, for 17 days without rain.
Check the weather over the last 5 years for the dates of your stay
Weather history day by day
Weather Nairobi in August
Sea: 32 °
| 11 d/month | 10 d/month | 8 d/month | 2 d/month |
In August, in Nairobi, l'amplitude des températures varient de 12 à 24 ° dans la journée. The average rainfall is around 29 inches, for 18 days without rain.
Check the weather over the last 5 years for the dates of your stay
Weather history day by day
Weather Nairobi in September
Sea: 32 °
| 11 d/month | 10 d/month | 8 d/month | 1 day |
In September, in Nairobi, l'amplitude des températures varient de 12 à 26 ° dans la journée. Temperatures are hot. The average rainfall is around 21 inches, for 22 days without rain.
Check the weather over the last 5 years for the dates of your stay
Weather history day by day
Weather Nairobi in October
Sea: 32 °
| 12 d/month | 9 d/month | 9 d/month | 1 day |
In October, in Nairobi, les températures moyennes le matin sont de %s et de %s ° l'après midi. Temperatures are hot. The average rainfall is around 36 inches, for 18 days without rain.
Check the weather over the last 5 years for the dates of your stay
Weather history day by day
Weather Nairobi in November
Sea: 32 °
| 17 d/month | 7 d/month | 3 d/month | 3 d/month |
In November, in Nairobi, Minimum temperatures vary between 15 in the morning and 25 in the afternoon. The average rainfall is around 151 inches, for 11 days without rain.
Check the weather over the last 5 years for the dates of your stay
Weather history day by day
Weather Nairobi in December
Sea: 32 °
| 13 d/month | 11 d/month | 5 d/month | 2 d/month |
In December, in Nairobi, les températures moyennes le matin sont de %s et de %s ° l'après midi. The average rainfall is around 79 inches, for 18 days without rain.
Check the weather over the last 5 years for the dates of your stay
Weather history day by day